

The recent Color 22 conference had an interesting speaker: dr. Terry Wu, about neuromarketing. My LinkedIn feed was full of it! And neuromarketing is an exciting topic. E.g. emotions can influence our perceptions. Knowing you are tasting Coca-Cola makes it taste much better (yes, it does!). And color is, of course, also an important input for our brain. But don’t get overexcited… Let’s take a deeper look at the Google ’41 shades of blue’ experiment (which became the 50 shades of blue over time). It has supposedly increased the advertising revenue by 200 Million US$! However: when put into perspective, it’s less spectacular. And even more: the test was fundamentally flawed.
CONTENTS: Neuromarketing | Putting it into Perspective | Input known, but output unknown | One more thing | Why is this important?
After seeing all these nice comments on his presentation, I contacted dr. Wu and he responded pretty fast. He also pointed me to his Ted Talk a few years ago. Fascinating! And I agree: neuromarketing is undoubtedly a thing, only last week I read a scientific report on how you can make cookies taste better: just state that it is a ‘new and improved’ formula. It’s that simple. Really! It’s something called ‘framing’.
What I also found intriguing, is the Google (close to) 50 shades of blue story. By finding ‘the right’ blue, they made 200.000.000 US$ more in advertising revenue. Sounds impressive.
So, I wanted to learn more about this test, e.g. how they executed it and their findings. With the Google offices filled with the best and brightest, this must be well-designed research. With rock-solid results.
Putting it into Perspective
The first thing I checked, the easy part, was that 200.000.000 US$ and, more specifically: what does that represent? It’s a lot of money, I would be happy with even a tiny fraction of that. But putting it in the Google perspective, it’s not that much. In 2009, the year of the study, Google had revenue from search advertising totaling 22,89 billion US$. So, the 200.000.000 US$ is even less than 1%. If the Google engineers had stated that their research showed that a different color would result in a less than 1% increase, you might have looked at it differently. That’s such a slight increase, you could argue other factors were influencing the results.
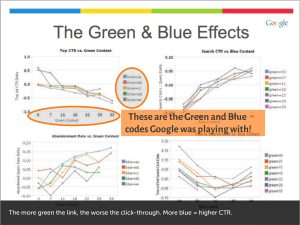
Next, I tried to find more information about that experiment, but it was hard to find. Except for one presentation, called Metrics Driven Design by Joshua Porter (you can also download a PDF-version with some annotations here). This one shows a bit more information, although not entirely accurate. Slide 5 shows a gradient from a certain green to blue and states that they had 41 buckets.
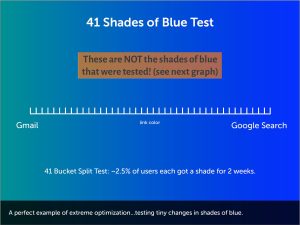
When looking at the next slide, it offers more information about the shades of blue. When looking at the different graphs, you can make up the different color codes used. And there isn’t that much green in it… (the numbers are very low: 00 to 33; please keep in mind that hex codes have 256 shades).
The color that was eventually selected was, depending on the source, #2200CC or #2200C1.
Suppose that the red stayed the same, I can create 35 shades of blue based on the green (00; 07; 11; 18; 22; 29; 33) and blues (aa; bb; cc; dd; ee). I put them into a Photoshop document, and the first thing that came to my mind was that it’s tough to see a difference between many of them. Changing the green (especially the low numbers) doesn’t make much difference to me (and I do have ‘normal’ vision). Changing the blue makes it lighter.
And these were blocks in a Photoshop document, so areas filled with the same color. What would that look like when using text? Here are seven variations, the text is the color code. Do you see a difference?
#2200aa; #2207aa; #2211aa; #2218aa; #2222aa; #2229aa ; #2233aa
So, I was a bit suspicious that such tiny changes in the text color would make a big difference.
Input known, but output unknown
But then came the ‘aha’ moment: these numbers represent the input, the color code that Google sends out to the users. But how do they know what color the monitor is showing? As clever as they are, they can not control the monitors used (unless it is a strictly controlled environment, which wasn’t the case). That monitor could be AdobeRGB capable and calibrated. But it could also be a less than sRGB, uncalibrated one (remember, the test was done in 2009, when many monitors weren’t even capable of representing the complete sRGB gamut). Or what about people that have adjusted the brightness of the monitor, which will result in a different color? So, what is the value of a color-related study if you don’t have control over the most critical element: the monitor?
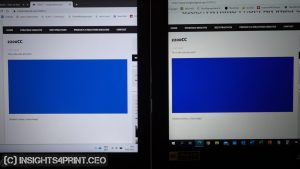
This is the page I used for the picture above: https://www.insights4print.ceo/2200CC/ Check it out yourself! Open this page on different devices, like laptops, tablets, smartphones, monitors and see what that same input looks like on these different devices.
To make an analogy: this would be the same as print buyers sending out PDFs and only judging the print quality based on that PDF, not the actual print, the ink on the substrate. Would that be ok? And dear printer: make this analogy if you ever have a customer (or consultant) using this Google 41 shades of blue story to enforce you to print within an unrealistic margin.
So, again, we need to disqualify a color-related study that sounded like music in our ears… Please, don’t draw any color-related conclusions from this Google study!
This unknown, uncontrollable output is a technicality, dr. Terry Wu probably isn’t aware of it. But the engineers at Google should have known it.
BTW: if you look closely at the graphs, you can e.g. see that one is about the CTR (click-through rate). And what is the delta between the worst and the best? 0,15. Is this significant? If you use it as a multiplier for your turnover, it shows a nice figure. But is this really more than just random fluctuations? Please enlighten me!
When looking at these different colors, what might have made a difference is the legibility of the text. Some colors are easier (or more comfortable) to read than others, especially on a monitor. But that doesn’t necessarily translate into print and logos.
One more thing…
And one more thing. Not only Google did this kind of research, but Microsoft also did this, for their Bing search engine. Probably one year later. And their ’80 million US$ color’ is another blue… It’s #0044CC. Are Bing users so different from Google users that they prefer a different blue?
#2200CC | #0044CC |
BTW: their 80 million US$ blue seems much less than Google’s 200 million US$ blue, but remember that the market share of Bing in 2010 was much smaller than Google. So the increase in revenue of the Microsoft blue was, percentage-wise, much higher.
Why is this important?
We all want to feel important, we want to feel that our job matters. And in print, that translates to print quality, to color. So we love to hear stories that our products can make a big difference. Unfortunately, this desire can disable our critical thinking, as in Google’s 41 shades of blue story. People from the printing industry should have seen the flaw on the output side: Google had no control over the color shown on the monitors. Therefore turning the results useless.
Now for the record: I’m not saying print isn’t important. I love print. I love that the people in the printing industry are so passionate about their job and their work. But we need to get real about the alleged importance of slight color differences. I haven’t seen solid proof yet that these matter. The (in)famous Loyola study is on ‘business graphs’ (spreadsheets). Studies showing that color enhances brand recognition are on black & white advertising versus color. And now the Google study on the perfect blue has a serious technical flaw in it, turning it into a waste of time.
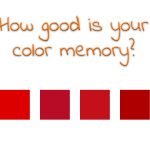
PS: now that we discussed that you don’t have control over what the participants see when doing color-related experiments online, I must tell you something. Something I’ve known from the start, but nobody (or maybe 1 person) addressed until now. The Coca-Cola Iconic Color Memory test that I have on my blog. I have no control over the visualization of the images. That’s why I also included the question if people were looking at it on a calibrated screen… Did it make a difference? There was a slight redistribution of the results, but the right one was still not the most popular. Added 13/03/2023: here are the results from that Coca-Cola Iconic Color Memory test.


The difference between the Google blue and the Bing blue is of course unforgiveable. But when you pick a colour for the web there is simply only one way to do that and that is to pick it on a calibrated monitor from a palette of colours that all fit within the sRGB colour gamut – much like the SMS sRGB colour palette. The fact that some people are viewing websites on old and uncalibrated monitors cannot affect this. Fortunately in our day and age most people are viewing websites on their quite new smartphones or tablets that are set up to display sRGB colours and more actually. This is basically the same methodology that we use when we prepare jobs for printing in CMYK. We use the appropriate icc profile for the printer + substrate, proof it on a proofing device with inline certification and perhaps send the proof to the printer to make sure they have something to use as an OK sheet right from the start. If the printer is unable to print the job according to the proof we will not pay for the job and they either get a chance to start over at their own cost – or we find another printer that can print to standards – close enough to make me happy when I compare a printed sheet to the proof. I am calling Google tomorrow to offer them my services. I eould have picked out just the right colours for them for 1/10th of that price 😇
HI Ingi, why is the difference between the Google blue and the Bing blue ‘unforgiveable’?
Ignore that. I read this too quickly and thought Google had accidently used another shade of blue on the Bing search machine – which of course doesn’t make sense since Microsoft and Google are currently not the same company ☺
Ah, ok… I’ll ignore you for not reading my words carefully… They deserve to be read carefully, they really do… 😉
It won’t happen again my friend 😇
Differing corporates, differing brand blues, as you may expect?
Well, not exactly in this case. Both claim they found their specific blue after A/B testing. So if there is a magic bullet for getting people to click on a search ad, shouldn’t they have found the same blue?
But they didn’t. One reason is that the setup of A/B testing of such tiny variations of color is just absurd: they are not in control of the monitor output. Just slightly changing the brightness of the monitor (which I do often when working on my laptop, depending on the hour of the day), will give a (very) different color.
And I don’t believe the tiny variations Google tested really make a differences, there are probalby multiple other factors that have a higher influence on clicking behavior than that color. IMO it’s just random noise, that in a certain case showed a kind of pattern, as can happen with random noise, if you look at it very closely…
In the end it all comes down to the monitor setting at the viewers end.
Most people using the Internet don’t have a clue how to set up a monitor , most come with sRGB out of the box. (being the industry standard set by Microsoft/HP).
I agree with Eddy’s point of view that the “Blue study” is flawed if it doesn’t take into consideration (or cannot by default) the variable of the monitor setting at the viewers end, as many fiddle around with brightness, contrast and so forth to get the monitor to their likings.
Looks to me like some really wasted R&D money there. 🙁
Thanks for your comment Jacques!
Maybe small addition / correction: the out of the box settings of most monitors may be sRGB, but that’s not a guarantee they can cover the full sRGB gamut. Especially at the time of that study (2009), many (office and home) monitors probably had a gamut smaller than sRGB.
These days, the primary screen of many users, the smartphone, might have a much larger gamut. The newest and high end even larger than AdobeRGB… This website has info about that: https://www.displaymate.com/mobile.html#Latest (I know, looks awfull, but great info!)
And I absolutely agree with your comment on wasted R&D. Those bright Google engineers should have known that they didn’t control the most important variable, the output.
Hi, Eddy: You point out various errors in the 41 Shades of Blue test, but this misses the larger point. Doug Bowman, Google’s designer, insisted design had to be done by humans. Google did this simple test of 41 shades of blue in 2007 and discovered decisions could be verified by testing. Google thus began testing everything. They learned how to do better tests and use better statistics.
This is called Conversion Rate Optimization (CRO). They test headings, text, images, location of images, location of buttons, colors and text in buttons, writing style, and many more factors. They control for location, day of week, hour of day, language, temperature, humidity, and more (for example, a few degrees of temperature has an effect on decisions).
Google now does 900,000+ tests annually. Most, if not all, companies over US$1B use CRO to design their websites, pages, products, and so on. Not just Silicon Valley corps. All banks, airlines, etc. use CRO.
Be careful when you search for CRO: the books and articles on the web are mostly amateur. Corporate-level CRO is done by people with PhDs in statistics and similar. Because this is so valuable and technical, there is very little publicly-available information about CRO.
Hi Andreas, thanks for your comment! But I think you must have misinterpreted my article. I’m only talking about that 41 shades of blue, not about other tests for conversion rate optimization. These other tests will be valid and deliver better results. But since Google had no control over the color that the user saw (since this color dependents on the capabilities of the monitor and the settings/calibration), that test is invalid. And they should have figured that out. Which shows that even clever people like PhDs can make mistakes.
Interesting article, but your comment in the photo caption about the different display outputs being “A serious flaw rendering the experiment useless” is a non sequitur. The CTR would have presumably been measured over a wide range of rendering devices and it is the aggregate response across the population of those devices that is meaningful (for their purposes), so individual variations are not relevant. It is true that the results might not be reliable over time as rendering technology changes and the population deviates significantly, but it’s not a problem on its face.
Thanks for your comment Tom! But I have to disagree.
First: when I, when my readers, talk about ‘color’, we are in this case talking about the spectrum that a monitor outputs for a given input, or translated into CIELab values (or Lab in short). When you have capable monitors that are also calibrated, that spectrum/Lab value will be the same for different monitors when using the same input. But capable and calibrated monitors are very rare when looking at the vast amount of internet users. And there can be a large variety of output, just visit a computer shop that has laptops on display and check the colors. Probably all of them will look slightly different.
Plus: the variations Google tested, were very small. Smaller than the variations between the capabilities of different monitors. Making an aggregate of that, would not fix the problem I raised. A large data set is not per definition the solution.
And: don’t forget that Microsoft did the same test, with a very different result… Their aggregate should be similar to that one from Google, it should have delivered the same result, if the test would have been reliable.
This analysis is not incorrect, but ignores 2 important things:
1) All colors will be differently interpreted by other monitors. Google picked the one color they could control that would improve/increase the CRO. If they picked a different shade, CRO would have been worse. Google does not care which shade of blue shows up on the monitor…they care about what they can control, and they picked the one that increases CRO, on average.
2) Microsoft’s best blue choice could certainly be different than Google’s best blue choice. For 2 (or more) reasons:
i. Tastes change over time and the population of users is different (one example: age-related)?
ii. Bing’s website does not look exactly like Google’s website. Conditional on these other factors in the webpage layout, the best choice for a shade of blue is likely different (as evidenced by the results).
Thx for your comment!
On 1: yes, all colors will be different interpreted (= shown) by other monitors. That’s exactly my point: Google does NOT control the output of the monitor. And therefor the test is just flawed. They didn’t pick one color that improved the CRO, they found a small random fluctation that they interpreted as a slightly higher CRO. But with NO control over the output, every conclusion they draw from the test is just not founded by evidence. It is NOT a controlled experiment.
On 2: yes, tastes can change, but there was only one year difference between the two tests. Could we see such a significant change in one year? And are Bing users so much different from Google users when it comes to age, gender, education, …? Do you have any evidence that supports that?
Surrounding colors can influence color perception, but the Google and Bing website are not that different. Both have a white background, with mainly text, most of it in black, just some text also in blue…
The evidence is stronger for my theory: there is no ‘magic’ blue, both teams wanted to find a magic blue and happened to find a small random fluctuation that was promoted to being the magic bullet for CRO…