

All statistics are clear: print goes down. The turnover of the printing industry goes down, the total of paper consumption goes down. But it’s not as bad as these figures show… This is why.
CONTENTS: Changing landscape | Paper industry statistics | Waste in printing companies | Why does this matter?
Changing landscape: printing outside of printing companies
It is a (well) known evolution: more and more printing is done outside of printing companies. And that – of course – shows in government data. Or better: a growing part of print isn’t shown in government data anymore… You might still find some traces in ‘neighboring’ industries like copy shops or advertising agencies, but when print moves from a commercial printer to inhouse printing, it leaves no trail in the general statistics. Just look around you: much printing has moved to the ‘office’ printer/copiers. Professional print might offer a slightly better quality and certainly more options, but people choose the easy route: just hit ‘print’ and the office printer a few meters away starts outputting a rather good print job. Everybody can do it. And everybody does.
Statistics from the paper industry to the rescue?
So where can we find better statistics? An important, reliable source could be the paper industry, the amount of paper that they sell. But even these figures should be handled with some caution…
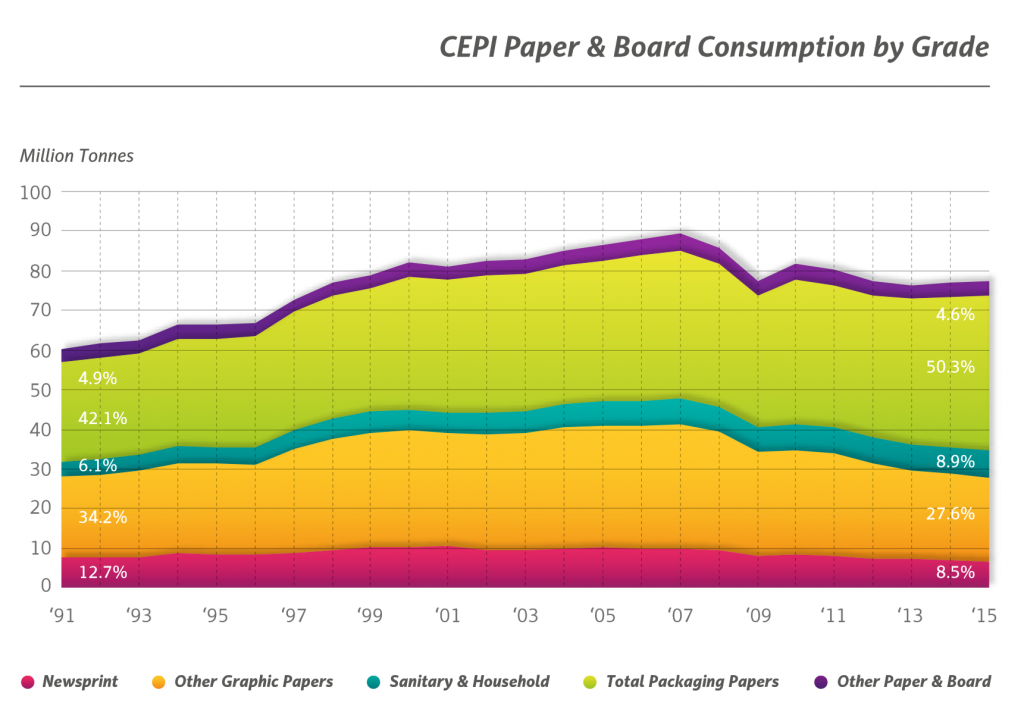
A really good source of statics on paper production and paper usage is CEPI, the Confederation of European Paper Industries, representing 22,8% of the global paper consumption. Every year they publish great statistics on the paper industry, including charts showing the evolution from 1991 to last year. So that should really give a good sense of what is happening to the printing industry.
If you look at the large scale statistic of paper consumption by CEPI, you will see that it reached the top in 2008 and what followed was a huge decline… Newsprint papers declined from 10.581.000 tons in 2008 to 6.606.000 tons in 2015, a loss of -37,5%. If we look at ‘other graphic papers’ (all graphic papers except newsprint) the consumption was 36.926.000 tons in 2008, only 21.339.000 tons remained in 2015… That’s an even bigger decline: -42,2%.
Paper waste inside printing companies…
But there is one evolution that you should take into account when looking at these figures: the decline of setup waste… The statistics only show you how much paper was consumed by customers of paper factories (printing companies). They do not show how much paper was delivered to customers of printing companies, to the user of printed material. And there used to be a big discrepancy between the amount of paper that was purchased by printers and the amount of paper that eventually ended up at their customers. There are only very few figures about paper waste in printing companies, but the ones that I’m aware of, are significant. Setup waste should not be neglected.
The best figure I’ve seen was from a printing company who hired two students to check their paper usage, about a decade ago. And it was astonishing what they found… nearly one third of the paper that was purchased was ‘waste’ of some kind! A part was waste from cutting and finishing. But a large part was setup waste… And that’s one thing that has changed significantly over the last decade: there is a lot less setup waste on modern printing presses and most of the thriving printing companies have invested in modern presses. The setup waste used to be several hundreds of sheets, sometimes even more than a thousand sheets. Now it is only a few dozen in many cases. And that makes a difference. And that’s an evolution that’s reflected in the paper consumption levels that you find in the CEPI figures: their figures of paper consumption decline faster than the paper consumption by print users.
Why does this matter?
The main conclusion is that you should always challenge figures and statistics. You should take a critical look at them, try to find out what is included and what is not included. You should try to find out why these figures evolve in a certain way. And the easy answer (‘print is dead’) is probably not the complete answer. Challenge the figures! Challenge yourself!


Be the first to comment