

The one statistic I’m always looking forward to, is the overview of the financial ratios of companies, published by the National Bank of Belgium (NBB). This gives a really good insight in how an industry performs, how companies in a specific industry perform. And there are two key conclusions you can draw from the latest figures. One: the printing industry isn’t a bad industry to be in, if you are a profit leader. Two: the gap between the profit leaders and laggards widens, again.
CONTENTS: Profitability printing companies: not bad… | Other industries | Big vs small? | Why is this important?
Just yesterday the figures for 2015 became public and I couldn’t wait to put them into a long term statistics datasheet. But first some background. The figures are derived from the annual accounts that all companies, big and small, need to publish in Belgium. They are lagging a bit behind on the actual situation, due to the time that companies have to file these accounts and the time the NBB needs to check and process them.
Profitability printing companies: not bad…
The main ratio I use to see how the industry is doing, is the net operating margin, it’s a rather simple ratio. Below you see the graph with the statistics from 1994 to 2015, so we are talking really long term statistics… The industry selected is ‘DE222: Printing and service activities related to printing’.
You can see four lines in the graph below. The grey one is the weighted mean. But that doesn’t give you a good insight. So I also included Q1, Q2 and Q3. Q1: 25% of the companies has a net operating margin below this figure. So we could say it defines the laggards. Q2: this is the median, which you could see as ‘the average printer’, 50% has a lower net operating margin, 50% has a higher net operating margin. Q3: 25% has a net operating margin above this figure, so here we are talking about the ‘profit leaders’. That’s your target if you are in the printing industry!
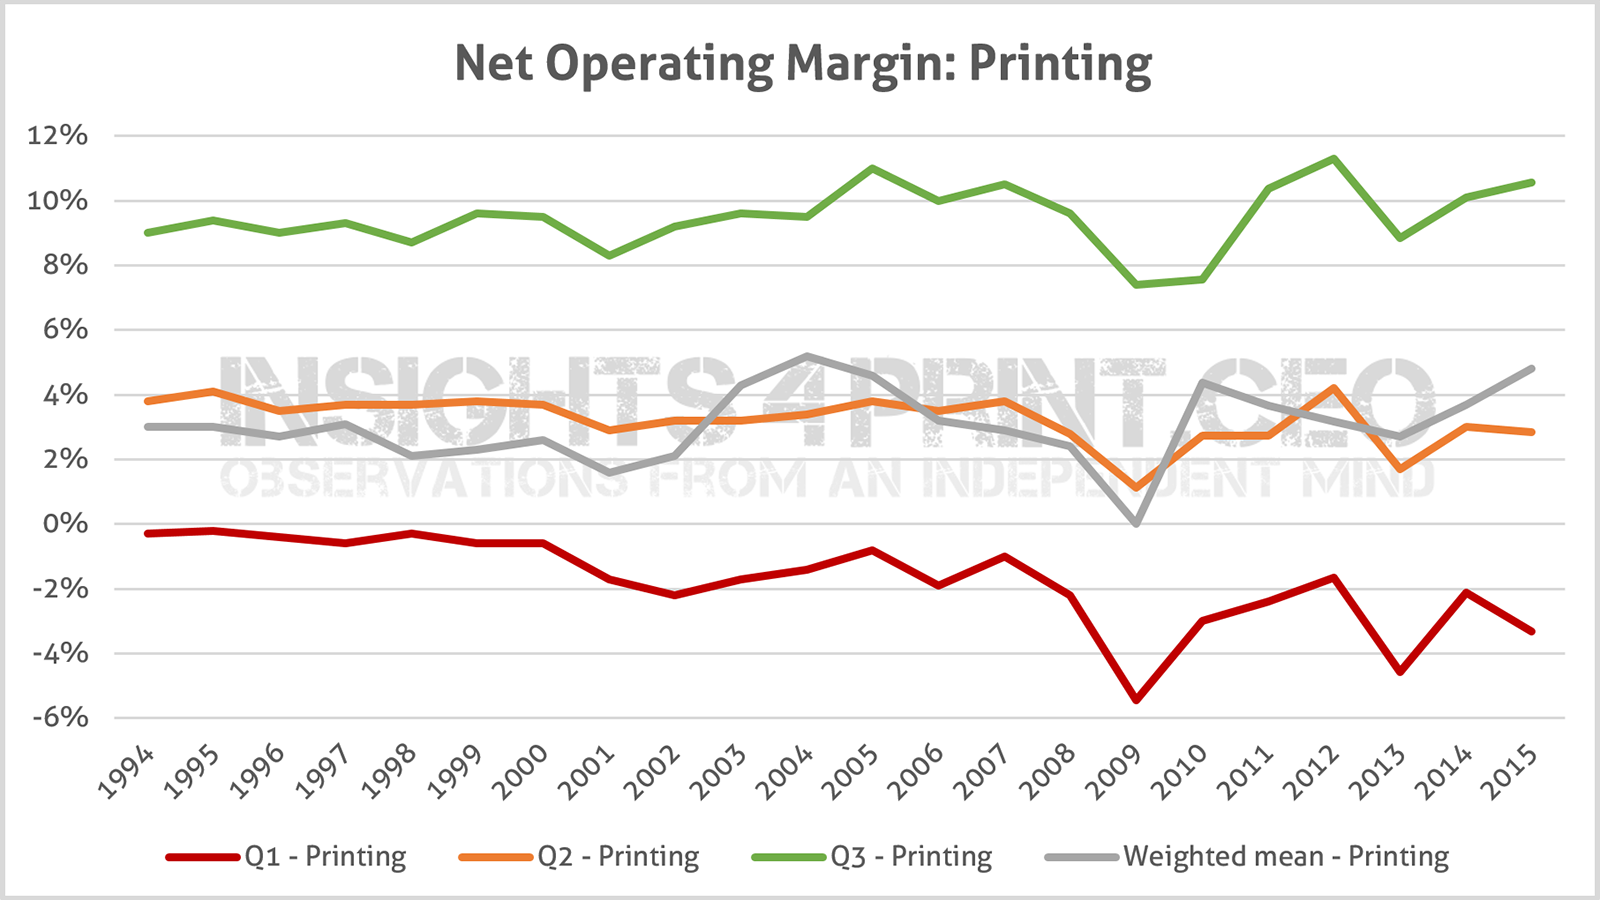
So what do we see? The profit leaders have a very decent net profit margin: over 10% in 2015. And with the excepting of 2009 and 2010, it has always been (well) above 8%. The median had a slight decline in 2015 (2,85%), generally it’s around 3%. Q1, the laggards, had a lower net operating margin in 2015 (3,32%) and this has been negative since the start of the statistics! That’s not good… This means that over 25% of the printing companies in Belgium have a negative net operating margin, they are losing money.
Other industries
Is the printing industry a ‘good’ or a ‘bad’ industry to invest in? Let’s compare that net operating margin for the printing industry with the figures from all manufacturing companies (PU290).
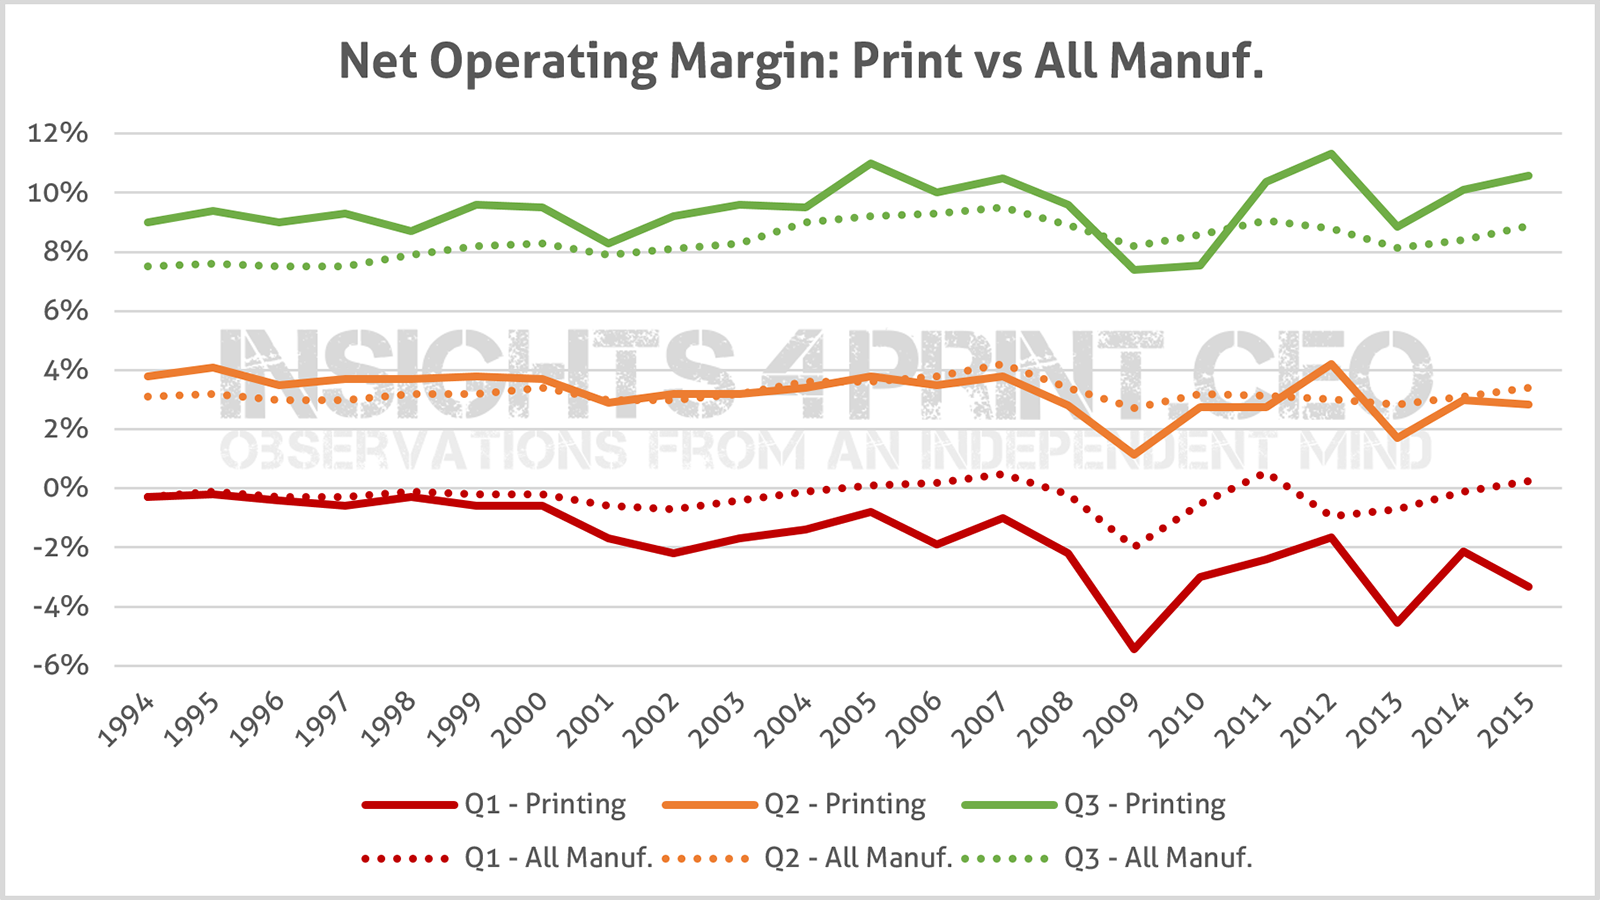
The solid lines represent the printing industry, the dotted lines all manufacturing companies. And what do we see? The printing industry is more extreme: our laggards have a lower net operating margin, but our profit leaders have a higher one, except for 2009 and 2010. So the printing industry is not a bad place to be, if you take the right approach and become a profit leader…
Based on these figures, I’ve also plotted the delta between Q3 and Q1, for both the printing industry and all of manufacturing. That looks like this, the orange lines are the trendlines.
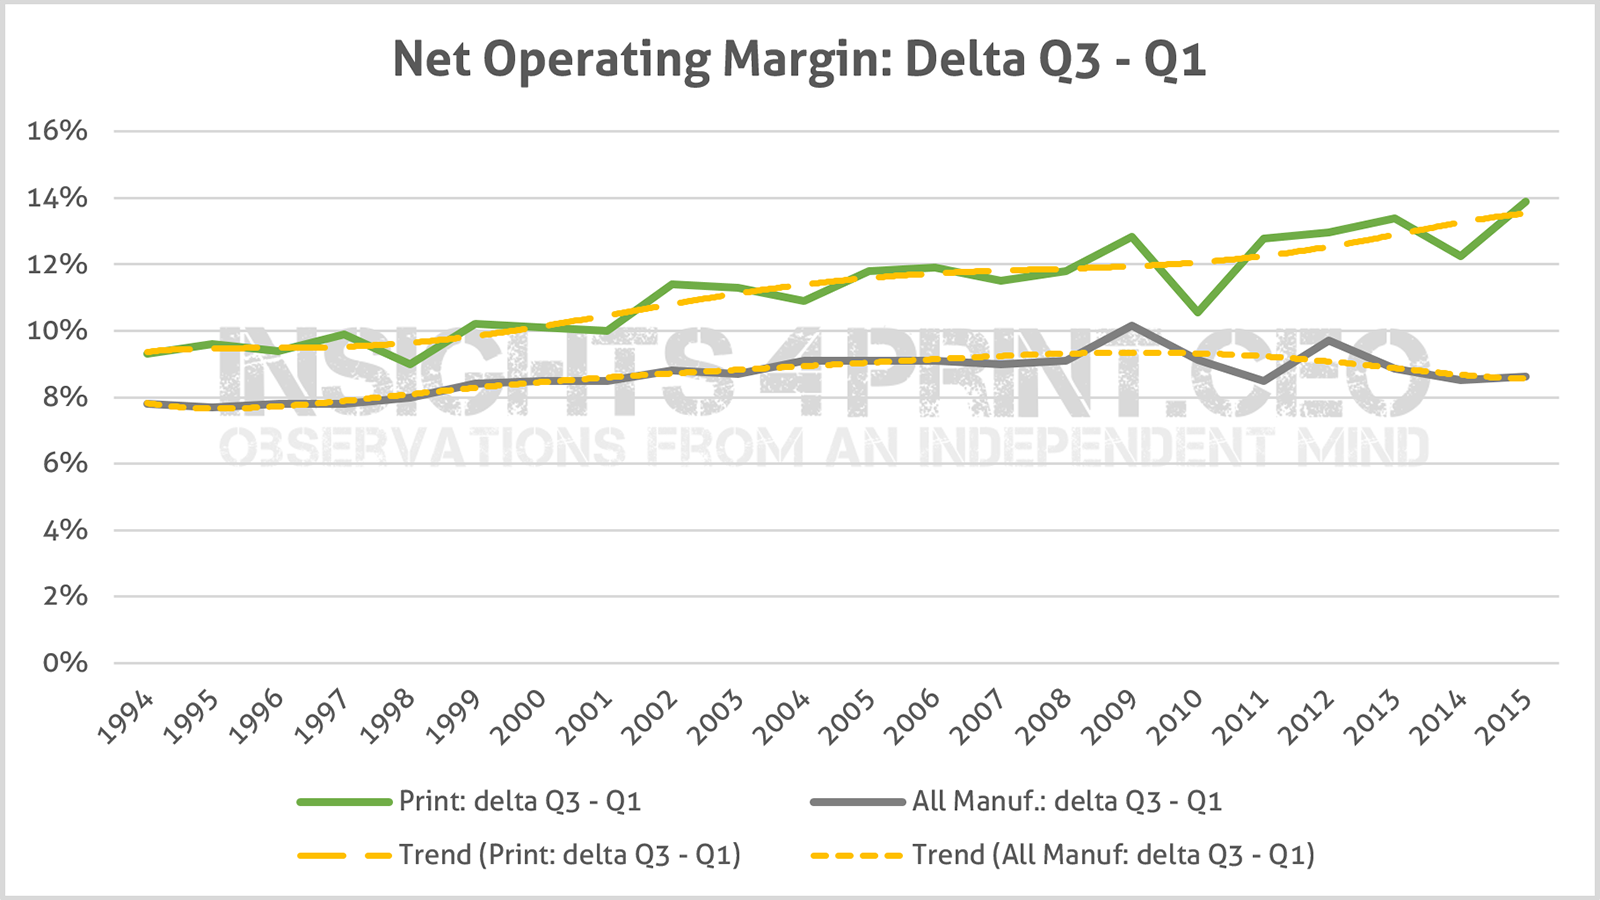
For both the printing industry and all of manufacturing we see the delta getting bigger, but the delta and the growth rate of that delta are bigger in the printing industry. Which is a sign on the wall, for the laggards.
Big vs small?
And then there is one more thing: is there a difference between larger and smaller companies? That might be a difficult one. But, there is one extra parameter in Belgium: depending on the size of the company, you either have to publish a complete annual account or an abbreviated version. For larger companies the complete annual account is mandatory, smaller companies can choose. There are three criteria, if a company exceeds 2 or 3 of these thresholds, a complete model is mandatory. A complete model is also mandatory if the company is listed on the stock exchange. These are the three criteria:
- Employees: 50 FTE
- Turnover: 9.000.000 euro
- Total balance sheet: 4.500.000 euro.
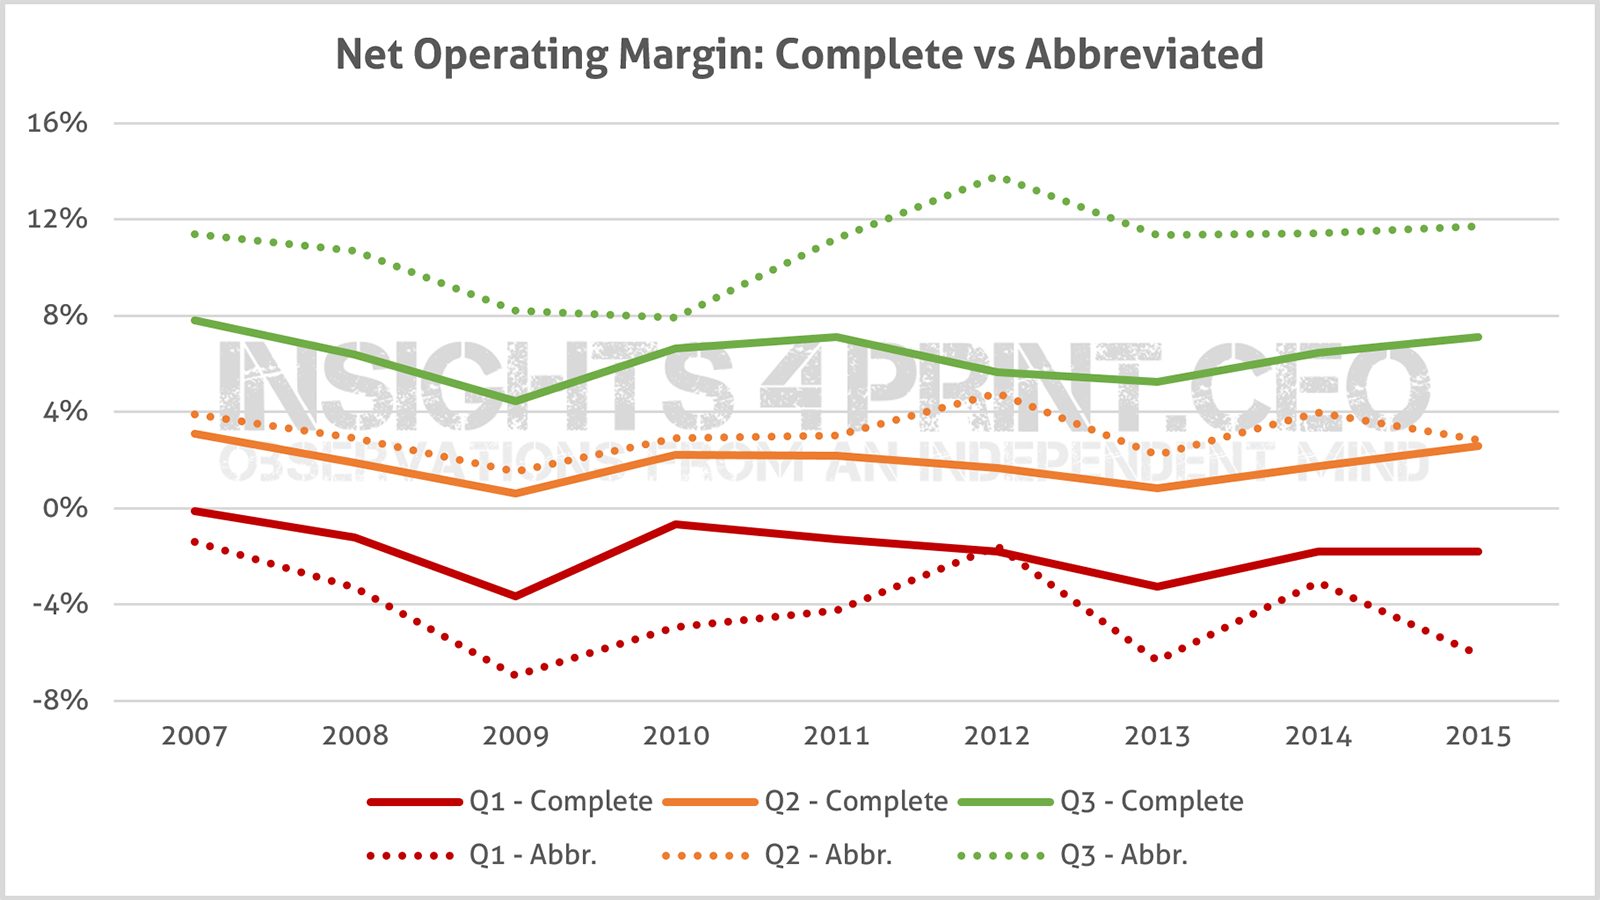
If we take the difference between complete and abbreviated annual accounts as the difference between big and small, we see that ‘smaller’ companies (the dotted lines) are more extreme than the larger ones (solid lines). Q3, the profit leaders, is higher for the smaller companies compared to the larger ones. But Q1, the laggards, is lower. For completeness, there are 138 printing companies with a complete and 195 with an abbreviated annual account in the 2015 sample (please note: there are much more printing companies in Belgium, but in the abbreviated annual account it is optional to mention the turnover, for the net operating margin ratio it is of course necessary)
Why is this important?
Every company should benchmark itself, on all kinds of parameters. Government data can be a very good source, as these figures from the NBB show. And the printing industry isn’t such a bad industry… if you are a profit leader. For the average printing company and certainly for the laggards, it’s a different story. But the profit leaders show it is possible to be (very) profitable in the printing industry. You just need the right approach, the right people, the right tools. And the right leadership to define, to engage those.
Be the first to comment