

These are my favorite statistics: the financial ratios derived from the annual accounts that companies are required to file. The most recent figures were published earlier this week, time for an update. And this time, it’s a bit of a mixed bag.
CONTENTS: Net operating margin printing industry | All manufacturing industries | Does size matter? | Why is this important?
As a C-level, president or shareholder of a company, you need good benchmarks to know if your company is performing well. From a financial point of view, the statistics derived from the annual accounts are from the best you can get. In Belgium, every company needs to file its annual account within a reasonable amount of time. And with some delay, the National Bank of Belgium publishes statistics based on those figures. The latest numbers are from 2017. Let’s take a look!
Net operating margin printing industry
You can see four lines in the graph below. The grey one is the weighted mean. But that doesn’t give you a good insight. So I also included Q1, Q2 and Q3. Q1: 25% of the companies have a net operating margin below this figure. So we could say it defines the ‘laggards’. Q2: this is the median, which you could see as ‘the average printer’, 50% has a lower net operating margin, 50% has a higher net operating margin. Q3: 25% has a net operating margin above this figure, so here we are talking about the ‘profit leaders’. That’s your target if you are in the printing industry!
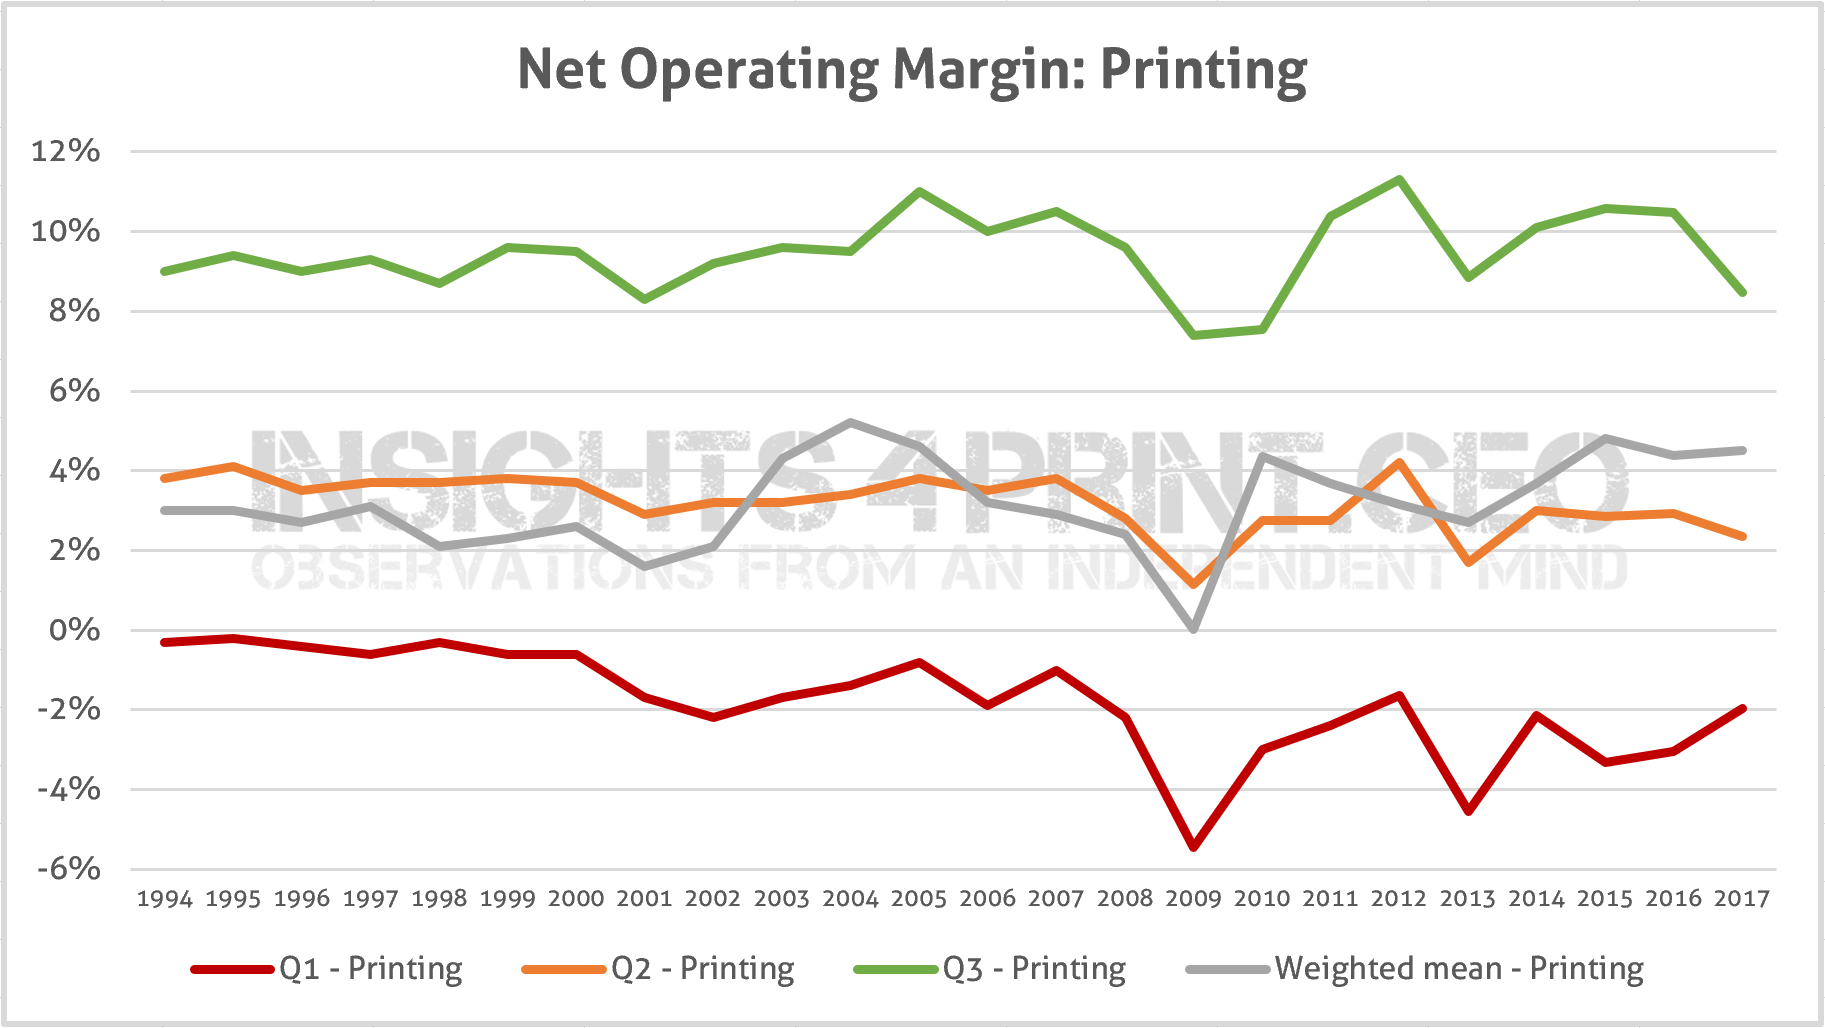
While the net operating margin stayed about the same in 2016, it had a rather significant decline in 2017 for the profit leaders (Q3). The average printer (Q2) also saw a slight decline. On the other hand, the laggards (Q1) showed an interesting increase in operating margin, but still, it was negative.
All manufacturing industries
From an investors point of view, it’s also interesting to take a look at the financials from other industries. In the graph below, you can see how the printing industry compares to all of the manufacturing companies.
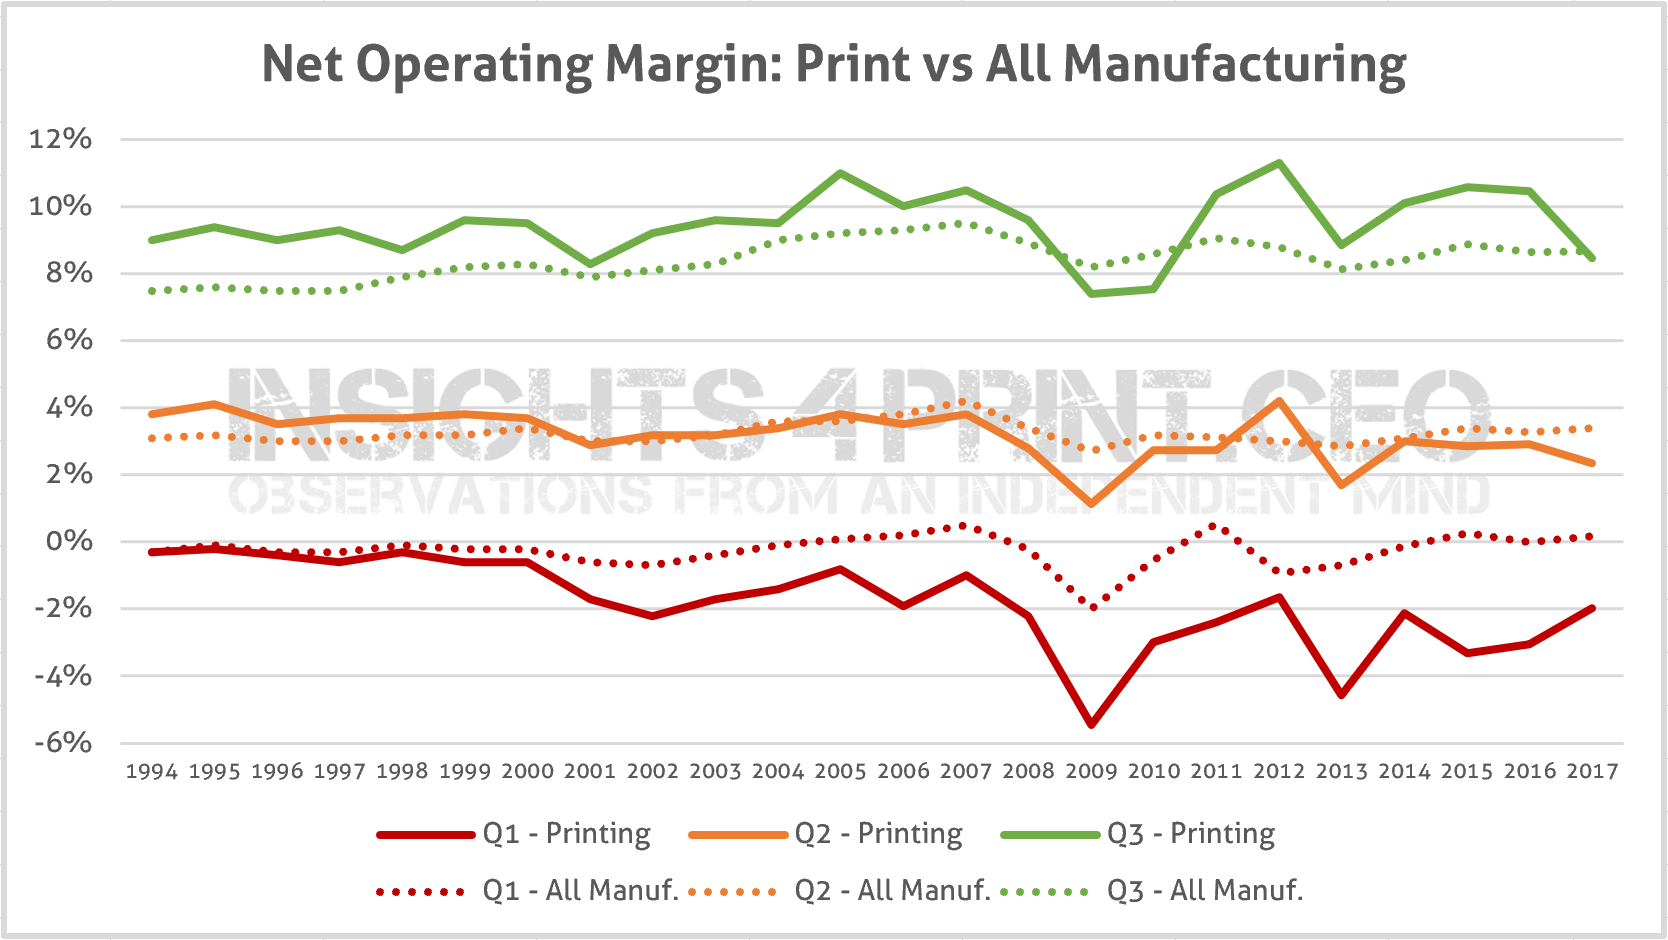
What’s immediately visible, is that the laggards from the printing industry still perform worse than the laggards of all of manufacturing. The profit leaders have always had a higher net operating margin, except for 2009 and 2010. But in 2017 it is about at the same point… Let’s hope the printing industry profit leaders can regain that slight advantage.
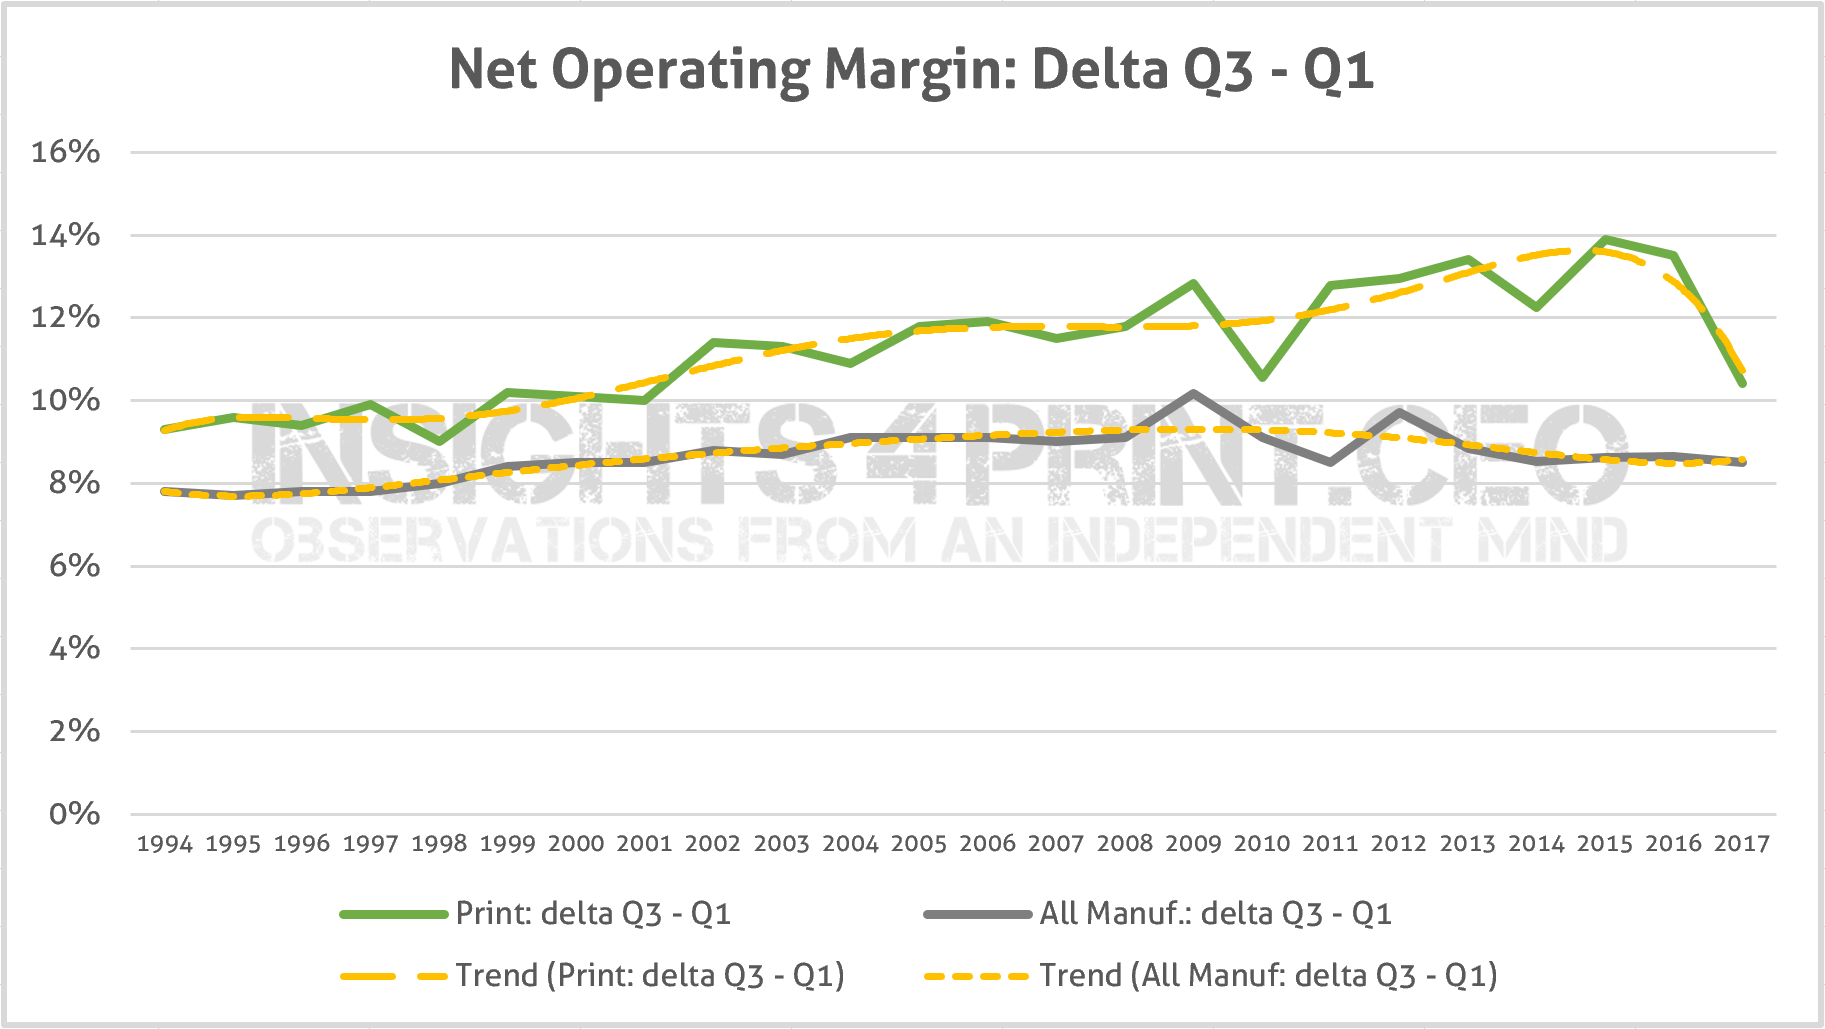
When looking at the difference between the profit leaders and the laggards, there used to be an ever-increasing gap. But that has stopped. For the last two years (2016, 2017), there is a rather strong decline. Which is caused, as seen above, by the improvement of the net operating margin of the laggards and the downturn of the net operating margin of the profit leaders.
As a reference, I’ve also added the same delta for all of the manufacturing industries, which is rather flat.
Does size matter?
The last graph I want to show you is related to size. Depending on the size of the company, the annual account should be using the complete, the abbreviated, or the micro model. The last one was introduced for the fiscal year 2016 and is applicable for companies that have exceeded only one of the three following criteria:
- employees: 10
- turnover: 700.000 euro
- total balance sheet: 350.000 euro
The difference between the complete and abbreviated model is based on the following criteria. If a company exceeds 2 or 3 of these thresholds, a complete model is mandatory. A complete model is also mandatory if the company is listed on the stock exchange.
- employees: 50 FTE
- turnover: 9.000.000 euro
- total balance sheet: 4.500.000 euro
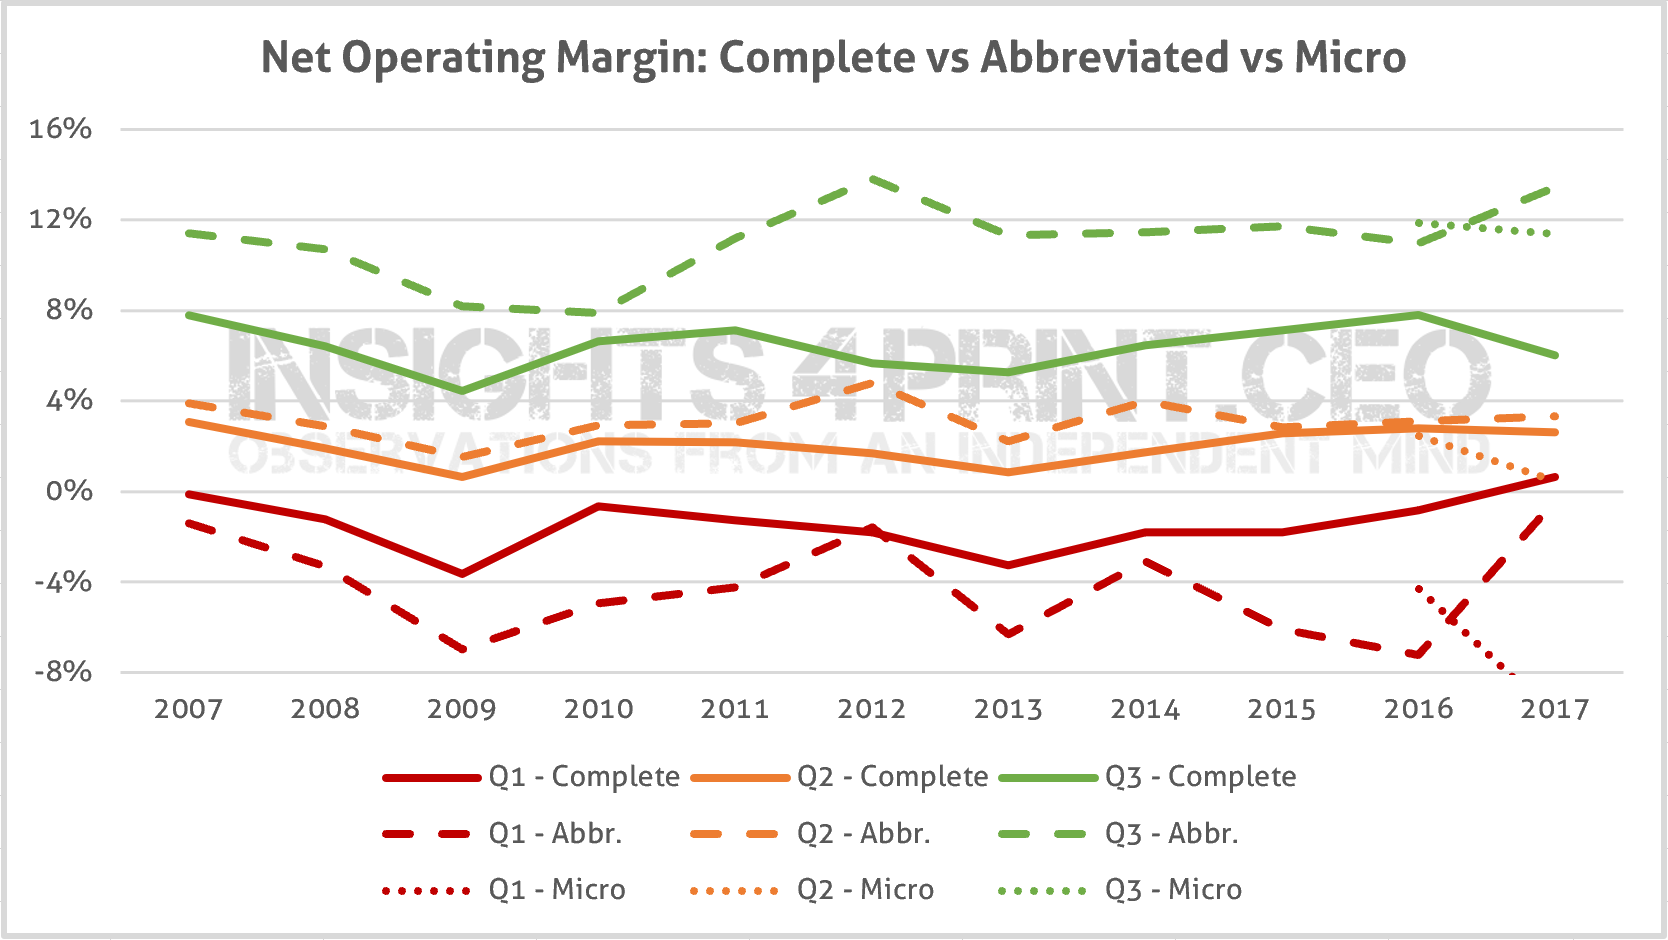
Based on this graph, we can conclude that the mid-sized companies are the best performers: all three values are higher than for both the large and small companies. And especially in 2017, we see an increase in the net operating margin, both for Q1 and Q3.
Why is this important?
Every company should benchmark itself, on all kinds of parameters. Government data can be a very good source, as these figures from the NBB show.
Compared to previous years and all of the manufacturing industries, 2017 has been a hard year for profit leaders and the average printing companies. But even here there is an interesting nuance: mid-sized printing companies had (much) better results than large and small-sized printing companies. Which again proves the necessity of the right approach, the right people, the right tools. And the right leadership to define, to engage those.
PS: here you can find the first article on the printing industry profitability, from 2017.
Be the first to comment